About J AND S INVESTMENTS PRIVATE LIMITED
J AND S INVESTMENTS PRIVATE LIMITED is a Private Limited Company and was incorporated on Jul 27, 1978 in India. It is registered at Registrar of Companies, ROC Mumbai. Its registered address is 51/52, 05th Floor, Khatau Apartments 243 Walkeshwar Road, Malabar Hill, Mumbai City, Mumbai, Maharashtra, India, 400006. Its corporate identification number is (CIN) U65993MH1978PTC020524 and its current status is Active. Its industry classification as per MCA is non-Operating Financial Holding Companies (Investment Companies).
J AND S INVESTMENTS PRIVATE LIMITED's last Annual General Meeting (AGM) was held on Sep 30, 2025 as per records from Ministry of Corporate Affairs (MCA). J AND S INVESTMENTS PRIVATE LIMITED's authorised share capital is Rs. 10,000,000 and its paid up capital is Rs. 5,716,670.
J AND S INVESTMENTS PRIVATE LIMITED generated a revenue of Rs. 1.43Cr for the financial year ending on Mar 31, 2025.
Contact Details for J AND S INVESTMENTS PRIVATE LIMITED
- *****@gmail.com, *****@gmail.com
- Registered Address
- 51/52, 05th Floor, Khatau Apartments 243 Walkeshwar Road, Malabar Hill, Mumbai City, Mumbai, Maharashtra, India, 400006
Principal Business Activity of J AND S INVESTMENTS PRIVATE LIMITED
Main Activity Group Code | Description of Main Activity | Business Activity Code | Description of Business Activity | Turnover Percentage |
|---|---|---|---|---|
K | Financial and insurance Service | K8 | Other financial activities | oxk |
Financials of J AND S INVESTMENTS PRIVATE LIMITEDFY 25 Available
Financial Statement Summary
Metrics | FY 2024-25 | FY 2023-24 | FY 2022-23 | FY 2021-22 | FY 2020-21 |
|---|---|---|---|---|---|
Income Statement | 1496 | 1499 | 8384 | 8038 | 5502 |
Revenue | 1489 | 1741 | 3094 | 1598 | 6385 |
EBITDA | 7396 | 3163 | 9632 | 2487 | 9257 |
Balance Sheet | 5314 | 2193 | 5370 | 3143 | 6883 |
Assets | 9458 | 3804 | 6344 | 4715 | 2130 |
Liabilities | 9232 | 9809 | 5128 | 6192 | 7074 |
Equities | 4919 | 4516 | 2127 | 9534 | 6945 |
Ratios
Metrics | FY 2024-25 | FY 2023-24 | FY 2022-23 | FY 2021-22 | FY 2020-21 |
|---|---|---|---|---|---|
Profitability Ratios | |||||
EBITDA Margin | 3297 | 2009 | 9926 | 8943 | 5056 |
Efficiency Ratios | |||||
Asset Turnover | 5455 | 2555 | 7868 | 3460 | 5579 |
Liquidity Ratios | |||||
Current Ratio | 8956 | 2194 | 4105 | 5018 | 4868 |
Quick Ratio | 3195 | 9233 | 6652 | 3248 | 3696 |
Growth Ratios | |||||
Revenue Growth Rate (CAGR) | 1887 | 5122 | 4024 | 4160 | 6435 |
Detailed Financials (Income Statement, Balance Sheet, Cashflow Statement)
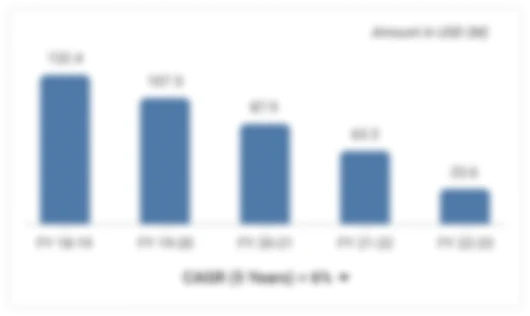
Compounded Annual Growth Rate of J AND S INVESTMENTS PRIVATE LIMITED
Revenue CAGR | Growth |
|---|---|
1 Year | 143% |
3 Year | 680 |
5 Year | 904 |
EBITDA CAGR | Growth |
|---|---|
1 Year | 1421% |
3 Year | 697 |
5 Year | 374 |