About XENIUM DEVELOPERS PRIVATE LIMITED
XENIUM DEVELOPERS PRIVATE LIMITED is a Private Limited Company and was incorporated on Mar 25, 2013 in India. It is registered at Registrar of Companies, ROC Delhi. Its registered address is BK-107/A, Ground Floor, Janta Flats, Shalimar Bagh, North West, Delhi, Delhi, India, 110088. Its corporate identification number is (CIN) U70200DL2013PTC249769 and its current status is Active. Its industry classification as per MCA is real Estate Activities On A Fee Or Contract Basis. [This Class Includes Buying, Selling, Renting Managing And Appraising Real Estate On A Fee Or Contract Basis. This Class Also Includes The Service Activities Provided By Munshi.].
XENIUM DEVELOPERS PRIVATE LIMITED's last Annual General Meeting (AGM) was held on Sep 30, 2024 as per records from Ministry of Corporate Affairs (MCA). XENIUM DEVELOPERS PRIVATE LIMITED's authorised share capital is Rs. 100,000 and its paid up capital is Rs. 100,000.
XENIUM DEVELOPERS PRIVATE LIMITED generated a revenue of Rs. 12.1K for the financial year ending on Mar 31, 2025.
Contact Details for XENIUM DEVELOPERS PRIVATE LIMITED
- *****@gmail.com
- Registered Address
- BK-107/A, Ground Floor, Janta Flats, Shalimar Bagh, North West, Delhi, Delhi, India, 110088
Principal Business Activity of XENIUM DEVELOPERS PRIVATE LIMITED
Main Activity Group Code | Description of Main Activity | Business Activity Code | Description of Business Activity | Turnover Percentage |
|---|---|---|---|---|
L | Real Estate | L2 | Real estate activities on fee or contract basis | vls |
Financials of XENIUM DEVELOPERS PRIVATE LIMITED
Financial Statement Summary
Metrics | FY 2023-24 | FY 2022-23 | FY 2021-22 | FY 2020-21 | FY 2019-20 |
|---|---|---|---|---|---|
Income Statement | 4853 | 4168 | 8731 | 7143 | 9889 |
Revenue | 4837 | 2195 | 8155 | 6388 | 6969 |
EBITDA | 4283 | 9495 | 4938 | 2846 | 1277 |
Balance Sheet | 4511 | 3173 | 3226 | 1906 | 2990 |
Assets | 3647 | 1827 | 6776 | 5800 | 5383 |
Liabilities | 1862 | 4287 | 7016 | 1544 | 5317 |
Equities | 7732 | 4814 | 8464 | 1187 | 8861 |
Ratios
Metrics | FY 2023-24 | FY 2022-23 | FY 2021-22 | FY 2020-21 | FY 2019-20 |
|---|---|---|---|---|---|
Profitability Ratios | |||||
EBITDA Margin | 4000 | 1821 | 3210 | 2638 | 7552 |
Efficiency Ratios | |||||
Asset Turnover | 1116 | 2178 | 4188 | 4948 | 5773 |
Liquidity Ratios | |||||
Current Ratio | 6636 | 2695 | 8023 | 6422 | 3274 |
Quick Ratio | 2025 | 7418 | 2951 | 3834 | 1205 |
Growth Ratios | |||||
Revenue Growth Rate (CAGR) | 7099 | 4740 | 6849 | 8280 | 4149 |
Detailed Financials (Income Statement, Balance Sheet, Cashflow Statement)
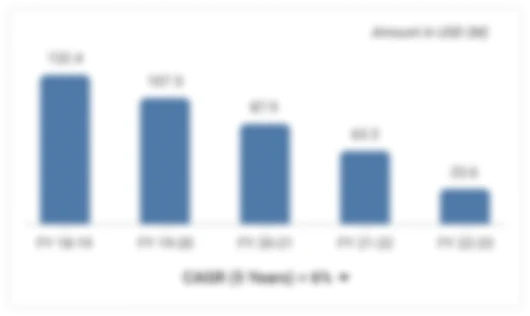
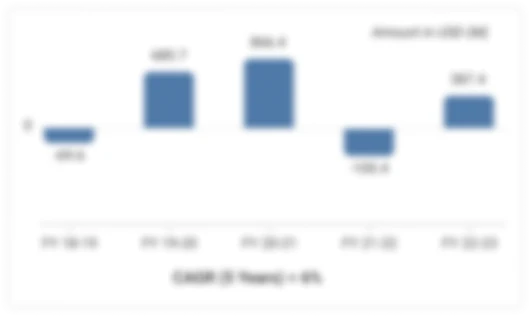
Compounded Annual Growth Rate of XENIUM DEVELOPERS PRIVATE LIMITED
Revenue CAGR | Growth |
|---|---|
1 Year | -100% |
3 Year | 803 |
5 Year | 285 |
EBITDA CAGR | Growth |
|---|---|
1 Year | -211% |
3 Year | 561 |
5 Year | 269 |
Profit CAGR | Growth |
|---|---|
1 Year | 20% |
3 Year | 257 |
5 Year | 944 |