About MTAP TECHNOLOGIES PRIVATE LIMITED
MTAP TECHNOLOGIES PRIVATE LIMITED is a Private Limited Company and was incorporated on Jan 08, 2013 in India. It is registered at Registrar of Companies, ROC Chennai. Its registered address is AMBIT IT Park, No.32, A & B, Second Main Road, Ambattur Industrial Estate, Chennai, Chennai, Tamil Nadu, India, 600058. Its corporate identification number is (CIN) U72900TN2013PTC089299 and its current status is Active. Its industry classification as per MCA is other Computer Related Activities [For Example Maintenance Of Websites Of Other Firms/ Creation Of Multimedia Presentations For Other Firms Etc.]. It had a team size of 113 employees as on Aug 31, 2025.
MTAP TECHNOLOGIES PRIVATE LIMITED's last Annual General Meeting (AGM) was held on Sep 30, 2025 as per records from Ministry of Corporate Affairs (MCA). MTAP TECHNOLOGIES PRIVATE LIMITED's authorised share capital is ₹3Cr and its paid up capital is ₹2.61Cr. The current board of directors of MTAP TECHNOLOGIES PRIVATE LIMITED comprises Srinivas Chitturi, Satvir Singh Kohli and 1 more.
MTAP TECHNOLOGIES PRIVATE LIMITED generated between ₹10 Cr and ₹50 Cr in revenue for the financial year ending on Mar 31, 2025.
Contact Details for MTAP TECHNOLOGIES PRIVATE LIMITED
- *****@mtap.in
- Registered Address
- AMBIT IT Park, No.32, A & B, Second Main Road, Ambattur Industrial Estate, Chennai, Chennai, Tamil Nadu, India, 600058
Brands associated with MTAP TECHNOLOGIES PRIVATE LIMITED
Name | Short Description | Founded Year | Location | Current Stage |
|---|---|---|---|---|
Cloud-driven sensor-based end-to-end fleet management solution for fleet operators | 2013 | Seed | ||
Platform offering employee transport automation and employee benefit solutions | 2014 | Funding Raised | ||
AI & cloud-driven vehicle fleet management solution for fleet operators | 2021 | Unfunded | ||
SaaS-driven school bus management solution | 2016 | Unfunded |


Principal Business Activity of MTAP TECHNOLOGIES PRIVATE LIMITED
Main Activity Group Code | Description of Main Activity | Business Activity Code | Description of Business Activity | Turnover Percentage |
|---|---|---|---|---|
J | Information and communication | 62 | Computer programming, consultancy and related activities | zgg |
Documents of MTAP TECHNOLOGIES PRIVATE LIMITEDFY 25 Available
Filing Summary
Here is a summary of filing activity and document availability across financial years:
File Type | FY 24-25 | FY 23-24 | FY 22-23 | FY 21-22 | FY 20-21 |
|---|---|---|---|---|---|
Financial Statements | |||||
Annual Returns |
Latest Financials, Share Allotment and Annual Report
The latest filed financial documents, annual reports, and share allotment filings are shown below:
Recent Filings
Below are the most recent filings submitted by the company:
Document Name | Category | Filing Date |
|---|---|---|
Form DPT-3 | Other eForm Documents | Jun 10, 2026 |
Form MSME | Other eForm Documents | Apr 21, 2026 |
Form PAS-3 | Other eForm Documents | Feb 07, 2026 |
List of Allottees | Other eForm Documents | Feb 07, 2026 |
Optional attachment(s)- if any | Other eForm Documents | Feb 07, 2026 |
Optional attachment(s)- if any | Other eForm Documents | Feb 07, 2026 |
Form MGT-7A | Annual Returns and Balance Sheet eForms | Dec 26, 2025 |
List of share holders, debenture holders | Annual Returns and Balance Sheet eForms | Dec 26, 2025 |
e-Director’s Report | Annual Returns and Balance Sheet eForms | Dec 26, 2025 |
Details of other entity(s) | Annual Returns and Balance Sheet eForms | Dec 26, 2025 |
Financials of MTAP TECHNOLOGIES PRIVATE LIMITEDFY 25 Available
Financial Statement Summary
Metrics | FY 2024-25 | FY 2023-24 | FY 2022-23 | FY 2021-22 | FY 2020-21 |
|---|---|---|---|---|---|
Income Statement | |||||
Revenue | 4315 | 8081 | 8942 | 4659 | 5184 |
Total Sales | 3925 | 7457 | 8502 | 6521 | 6134 |
Total Expenses | 3761 | 1655 | 5326 | 7617 | 2899 |
Operating Expenses | 4213 | 9129 | 5678 | 9550 | 4804 |
Employee Expenses | 7652 | 1759 | 5893 | 8983 | 6487 |
Operating Income (EBIT) | 4533 | 9777 | 9724 | 4267 | 8736 |
Interest Expenses | 9428 | 3147 | 9410 | 7553 | 3880 |
Expenses from other activities | 8940 | 8339 | 2674 | 7610 | 7159 |
EBITDA | 6752 | 3547 | 5049 | 3366 | 7071 |
Taxes | 2028 | 7476 | 1404 | 7165 | 8648 |
Net Profit | 1531 | 8058 | 1822 | 1742 | 4606 |
Balance Sheet | |||||
Assets | 6503 | 9381 | 1021 | 6601 | 6751 |
Accounts Receivables | 7642 | 6316 | 3383 | 6325 | 8146 |
Inventory | 9437 | 3965 | 8516 | 3460 | 3696 |
Liabilities | 5024 | 5435 | 7237 | 9464 | 7966 |
Total Debt | 4290 | 7386 | 6394 | 1307 | 8008 |
Accounts Payable | 2034 | 3146 | 1245 | 5105 | 9612 |
Equities | 6377 | 5367 | 4469 | 7926 | 6760 |
Ratios
Metrics | FY 2024-25 | FY 2023-24 | FY 2022-23 | FY 2021-22 | FY 2020-21 |
|---|---|---|---|---|---|
Profitability Ratios | |||||
EBITDA Margin | 2967 | 6126 | 2013 | 2911 | 7747 |
EBIT Margin | 3058 | 7235 | 6713 | 2053 | 6352 |
Net Profit Margin | 4881 | 4736 | 9326 | 1468 | 1988 |
Return on Assets (ROA) | 4468 | 1708 | 2577 | 1963 | 9260 |
Return on Equity (ROE) | 2150 | 7109 | 6654 | 2693 | 8315 |
Return on Capital Employed | 4496 | 2198 | 2579 | 8292 | 2372 |
Return on Invested Capital | 1796 | 5460 | 3122 | 5502 | 1886 |
Efficiency Ratios | |||||
Asset Turnover | 1394 | 5208 | 6173 | 8315 | 7410 |
Receivables Turnover | 1539 | 9451 | 2207 | 4682 | 8315 |
Days Sales Outstanding | 6648 | 3168 | 2817 | 3208 | 9829 |
Inventory Turnover | 3285 | 5274 | 4681 | 1048 | 9192 |
Days Inventory Outstanding | 1169 | 8609 | 8413 | 5244 | 7607 |
Payables Turnover | 1073 | 1323 | 6100 | 1785 | 5649 |
Days Payables Outstanding | 6474 | 9552 | 2762 | 7236 | 4523 |
Liquidity Ratios | |||||
Current Ratio | 5399 | 4257 | 1860 | 9047 | 6806 |
Quick Ratio | 6929 | 1696 | 3071 | 7070 | 5972 |
Debt Ratios | |||||
Debt-to-Equity Ratio | 4341 | 5413 | 5969 | 1499 | 1458 |
Debt Ratio | 9745 | 2619 | 5308 | 6201 | 6037 |
Interest Coverage Ratio | 1396 | 2658 | 6045 | 4741 | 3718 |
Debt Service Coverage Ratio | 3776 | 7537 | 3023 | 3712 | 7317 |
Net Debt/EBITDA | 9818 | 3495 | 5097 | 5470 | 5082 |
Growth Ratios | |||||
Revenue Growth Rate (CAGR) | 2019 | 8220 | 2678 | 5167 | 1280 |
Earnings Growth Rate (CAGR) | 5289 | 7540 | 9705 | 5180 | 6433 |
Detailed Financials (Income Statement, Balance Sheet, Cashflow Statement)
Compounded Annual Growth Rate of MTAP TECHNOLOGIES PRIVATE LIMITED
Revenue CAGR | Growth |
|---|---|
1 Year | 36% |
3 Year | 812 |
5 Year | 447 |
EBITDA CAGR | Growth |
|---|---|
1 Year | 15% |
3 Year | 962 |
5 Year | 176 |
MSME Payment Delays by MTAP TECHNOLOGIES PRIVATE LIMITED
Supplier Name | Supplier PAN | Amount Due | Due since |
|---|---|---|---|
R. Bupathy & Co | 4984 | 6643 | 6087 |
Loans and Charges on MTAP TECHNOLOGIES PRIVATE LIMITED
As a Borrower
Loan/ Charge ID | Lender Name | Loan Amount | Status | Creation Date | Closure Date |
|---|---|---|---|---|---|
100044732 | ₹1.5Cr | zrwqwqx | Jun 27, 2016 | iu{cdik |
GSTIN Details of MTAP TECHNOLOGIES PRIVATE LIMITED
Board of Directors and Signatories of MTAP TECHNOLOGIES PRIVATE LIMITED
Board of Directors of MTAP TECHNOLOGIES PRIVATE LIMITED
Name | Designation | Status | Appointment Date | Duration |
|---|---|---|---|---|
Director | Current | Jan 22, 2018 | 8 Years 8 Months | |
Director | Current | Dec 07, 2020 | 5 Years 10 Months | |
Director | Current | Mar 10, 2025 | 1 Year 7 Months |
Signatories of MTAP TECHNOLOGIES PRIVATE LIMITED
Name | Designation(s) | Status | Appointment Date | Duration |
|---|---|---|---|---|
Director | Current | Mar 10, 2025 | 1 Year 7 Months | |
Director | Current | Dec 07, 2020 | 5 Years 10 Months | |
Director | Current | Jan 22, 2018 | 8 Years 8 Months |
Cross Directorships of MTAP TECHNOLOGIES PRIVATE LIMITED
Legal Entity Name | % of Common Directors | Common Director(s) | Open Charge(s) | Active Legal Case(s) |
|---|---|---|---|---|
AUTOROUTES TECHNOLOGIES PRIVATE LIMITED CIN: U72900KA2022PTC160448, India, Strike off | 619 | 190 | 279 | 925 |
FUTURE RESISTANT PLATFORM PRIVATE LIMITED CIN: U62091KA2023PTC173444, India, Active | 197 | 684 | 147 | 315 |
Funding and Investors of MTAP TECHNOLOGIES PRIVATE LIMITED
MTAP, the brand associated with MTAP TECHNOLOGIES PRIVATE LIMITED, has raised a total funding of $347K over 2 rounds. Its first funding round was on Oct 14, 2016. Its latest funding round was a Seed round on Mar 15, 2019 for $*****. 5 investors participated in its latest round. MTAP has 4 institutional investors and 12 angel investors.
Date of Funding | Funding Amount | Round Name | Post-Money Valuation | Revenue Multiple | Lead Investors | Other Investors |
|---|---|---|---|---|---|---|
Mar 15, 2019 | 8289062 | Seed | 9868078 | 7231076 | 3966852 | 4541042 |
Oct 14, 2016 | 4112174 | Seed | 6959636 | 9057740 |
Legal Cases involving MTAP TECHNOLOGIES PRIVATE LIMITED
Employee Count of MTAP TECHNOLOGIES PRIVATE LIMITED
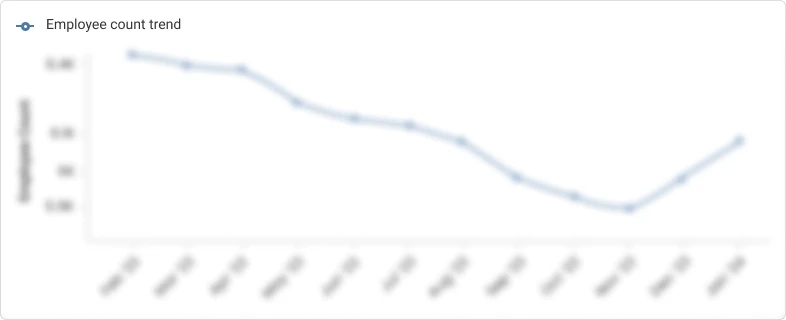
Date | Employee Count |
|---|---|
Aug 25 | 113 |
Jul 25 | 529 |
Jun 25 | 641 |
May 25 | 953 |
Apr 25 | 870 |
Mar 25 | 799 |
Feb 25 | 547 |
Competitors & Alternates of MTAP TECHNOLOGIES PRIVATE LIMITED
Rank | Company Details | Short Description | Total Funding | Investors | Tracxn Score |
|---|---|---|---|---|---|
1st |  Samsara 2015, San Francisco (United States), Public | Platform offering AI-powered and cloud-based vehicle tracking solutions for fleet owners | $915M | 87/100 | |
2nd |  Motive 2013, San Francisco (United States), Series G | Developer of fleet management software and hardware for vehicle tracking | $1.87B | 78/100 | |
3rd |  Radius 1990, Crewe (United Kingdom), Acquired | Predictive marketing and sales platform | $333M | 76/100 | |
4th | Wright Express 1983, Portland (United States), Public | Provider of fleet management, employee benefits, and business payment solutions | - | 74/100 | |
5th | HERE 1985, Eindhoven (Netherlands), Acquired | Developer of a unified map delivering location data and related services | - | 71/100 | |
6th | Provider of revenue-based vehicle financing to mobility entrepreneurs | $472M | 70/100 | ||
7th | Spireon 2003, Knoxville (United States), Acquired | Saas-enabled fleet and field service management solutions | $7.71M | 66/100 | |
8th |  Element 1946, Baltimore (United States), Public | Fleet management and maintenance services | $125M | 71/100 | |
9th | LightMetrics 2015, Bengaluru (India), Series A | Provider of video telematics solutions for telematics service providers | $10.7M | 68/100 | |
10th | GreenRoad 2004, Austin (United States), Series E | Provider of fleet telematics and management solutions | $81.5M | 68/100 | |
16th | Cloud-driven sensor-based end-to-end fleet management solution for fleet operators | $347K | 65/100 |

News related to MTAP TECHNOLOGIES PRIVATE LIMITED
 Get curated news about company updates, funding rounds, M&A deals and others. Sign up today!


