
Chartink - About the company
Chartink is an unfunded company based in Pune (India), founded in 2010 by Akash Bedi. It operates as a Charting platform for stock markets. Chartink has not raised any funding yet. The company has 839 active competitors, including 2 funded and 1 that has exited. Its top competitors include companies like TradingView, GoCharting and FinansCepte.
Company Details
Charting platform for stock markets. Provides nifty live, intraday charts, Sensex share price, NSE BSE EOD charts, live charts, point and figure charts, live NSE charts, candlestick charts, and more. Offers a technical scanner or screener with multiple technical indicators.
- Website
- chartink.com
- Social

- Email ID
- *****@chartink.com
- Registered Address
- T-19/20,SATYAMSHOPPINGCENTRE,A'WING,GARODIANAGAR,M.G.ROAD,GHATKOPAR(EAS, T), MUMBAI, Maharashtra, India, 400077
Key Metrics
Founded Year
2010
Location
Pune, India
Stage
Unfunded
Ranked
4th among 839 active competitors
Annual Revenue
₹10 - ₹50 Cr as on Mar 31, 2025
Employee Count
259 as on May 31, 2025
Similar Companies
Legal entities associated with Chartink
Chartink is associated with 1 legal entity given below:
Legal Entity Name | Date of Incorporation | Revenue | Latest Employee Count | Reports |
|---|---|---|---|---|
CMOTS INTERNET TECHNOLOGIES PRIVATE LIMITED CIN: U72200MH1997PTC111180 , India, Active | Oct 09, 1997 | ₹10 - ₹50 Cr (As on Mar 31, 2025) | 260 (As on Jul 31, 2025) |

Sign up to download Chartink's company profile
Chartink's funding and investors
Chartink has not raised any funding rounds yet.
Chartink's founders and board of directors
Founder? Claim ProfileThe founders of Chartink is Akash Bedi.
Here are the details of Chartink's key team members:
- Akash Bedi: Founder & Owner of Chartink. Contact Info: 1 email address and 1 phone number
View details of Chartink's Founder profiles and Board Members
Chartink's employee count trend
Chartink has 259 employees as of May 25. The total employee count is 3.0% more than what it was in May 24. Here is Chartink's employee count trend over the years: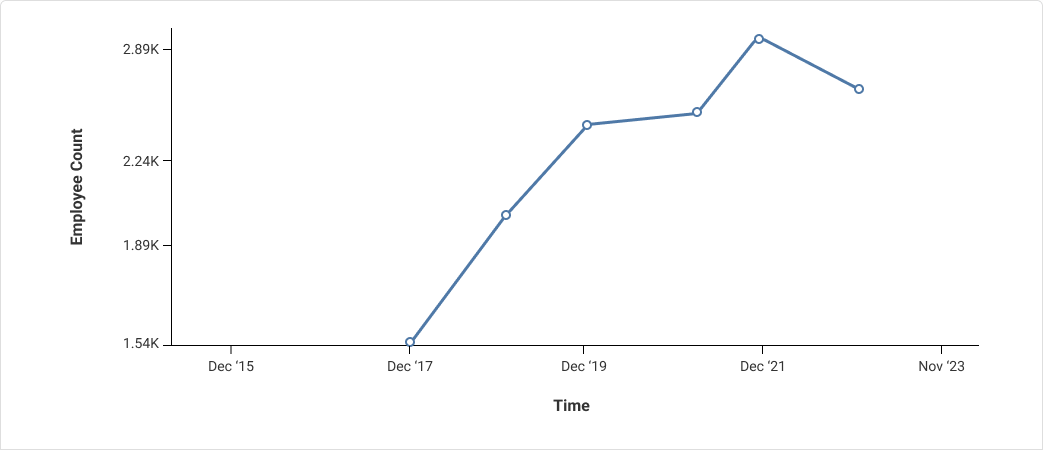
 Uncover Chartink's growth story! Sign up today!

Access Tracxn on any website
Install Tracxn ExtensionOur Google Chrome extension lets you view company details while browsing their websites
Chartink's Competitors and alternates
Top competitors of Chartink include TradingView, GoCharting and FinansCepte. Here is the list of Top 10 competitors of Chartink, ranked by Tracxn score:
Get insights and benchmarks for competitors of 2M+ companies! Sign up today!
Rank | Company Details | Short Description | Total Funding | Investors | Tracxn Score |
|---|---|---|---|---|---|
1st | TradingView 2011, New York City (United States), Series C | Financial platform for charting markets, analyzing assets, and sharing trading ideas | $339M | 75/100 | |
2nd |  GoCharting 2021, Middletown (United States), Series A | Multi-asset charting platform for individuals | - | 51/100 | |
3rd | FinansCepte 2014, Ankara (Turkey), Unfunded | Multiple financial products aggregator | - | - | 43/100 |
4th | Charting platform for stock markets | - | - | 42/100 | |
5th |  Trading AI 2025, San Francisco (United States), Unfunded | Developer of software providing technical analysis for various financial assets | - | - | 40/100 |
6th |  InvestCharts 2010, Sao Paulo (Brazil), Unfunded | App-based technical analysis platform for individuals | - | - | 39/100 |
7th | Stockcharts 1999, Redmond (United States), Unfunded | Advanced financial charting and technical analysis tools for smarter investing | - | - | 39/100 |
8th |  INO 1995, New York City (United States), Acquired | Provider of an app-based market research platform to find charts and analytics | - | - | 38/100 |
9th |  AmarStock 2017, Bangladesh, Unfunded | Provider of financial market analysis tools and stock trading data | - | - | 35/100 |
10th | Toss Securities South Korea, Unfunded | Provider of digital financial platforms facilitating stock market investment analysis | - | - | 34/100 |
 Get insights and benchmarks for competitors of 2M+ companies! Sign up today!
Looking for more details on Chartink's competitors? Click here to see the top ones
Financials of ChartinkFY 25 Available
CMOTS INTERNET TECHNOLOGIES PRIVATE LIMITED, the legal entity associated with Chartink, generated between ₹10 Cr and ₹50 Cr in revenue for the financial year ending on Mar 31, 2025. The revenue of CMOTS INTERNET TECHNOLOGIES PRIVATE LIMITED has a compounded annual growth rate (CAGR) of 19% in the last 1 year.
Financial Statement Summary
Metrics | FY 2024-25 | FY 2023-24 | FY 2022-23 | FY 2021-22 | FY 2020-21 |
|---|---|---|---|---|---|
Income Statement | |||||
Revenue | 3543 | 7609 | 3243 | 4670 | 1342 |
Total Sales | 9997 | 8747 | 8200 | 8858 | 4909 |
Total Expenses | 8835 | 9877 | 8730 | 3176 | 5920 |
Operating Expenses | 7985 | 8670 | 2662 | 9791 | 9419 |
Employee Expenses | 3979 | 2685 | 1645 | 8682 | 8678 |
Operating Income (EBIT) | 3074 | 7507 | 3501 | 3341 | 8880 |
Interest Expenses | 5804 | 8711 | 2050 | 8649 | 9243 |
Expenses from other activities | 4588 | 7724 | 7065 | 2077 | 4893 |
EBITDA | 3058 | 6082 | 7974 | 7529 | 3881 |
Taxes | 3829 | 8879 | 5840 | 9719 | 5892 |
Net Profit | 5998 | 5736 | 3987 | 7063 | 8415 |
Balance Sheet | |||||
Assets | 8620 | 9505 | 9519 | 8997 | 7161 |
Accounts Receivables | 8197 | 4082 | 6015 | 1949 | 9660 |
Inventory | 8547 | 5705 | 4837 | 4580 | 1661 |
Liabilities | 1146 | 3648 | 3318 | 9780 | 2556 |
Total Debt | 5967 | 4353 | 1599 | 3358 | 6102 |
Accounts Payable | 8187 | 7437 | 1081 | 8902 | 8709 |
Equities | 1817 | 4480 | 7198 | 4872 | 5794 |
Detailed Financials (Income Statement, Balance Sheet, Cashflow Statement)
Chartink's Investments and acquisitions
Chartink has made no investments or acquisitions yet.
Reports related to Chartink
Here is the latest report on Chartink's sector:

Are you a Founder ?
FAQs about Chartink
Explore our recently published companies
- DIV Protocol - Paris based, 2025 founded, Unfunded company
- D and H Fire - San Dimas based, 2016 founded, Funding Raised company
- Eye7 Eye Hospitals - Delhi based, 1987 founded, Unfunded company
- AiLuvio - Praha based, 2023 founded, Unfunded company
- Receptive Sports Technologies - Ludhiana based, 2022 founded, Unfunded company
- Goods For Health - Delhi based, 2025 founded, Unfunded company


